April 2026
AI Ticketing Beta
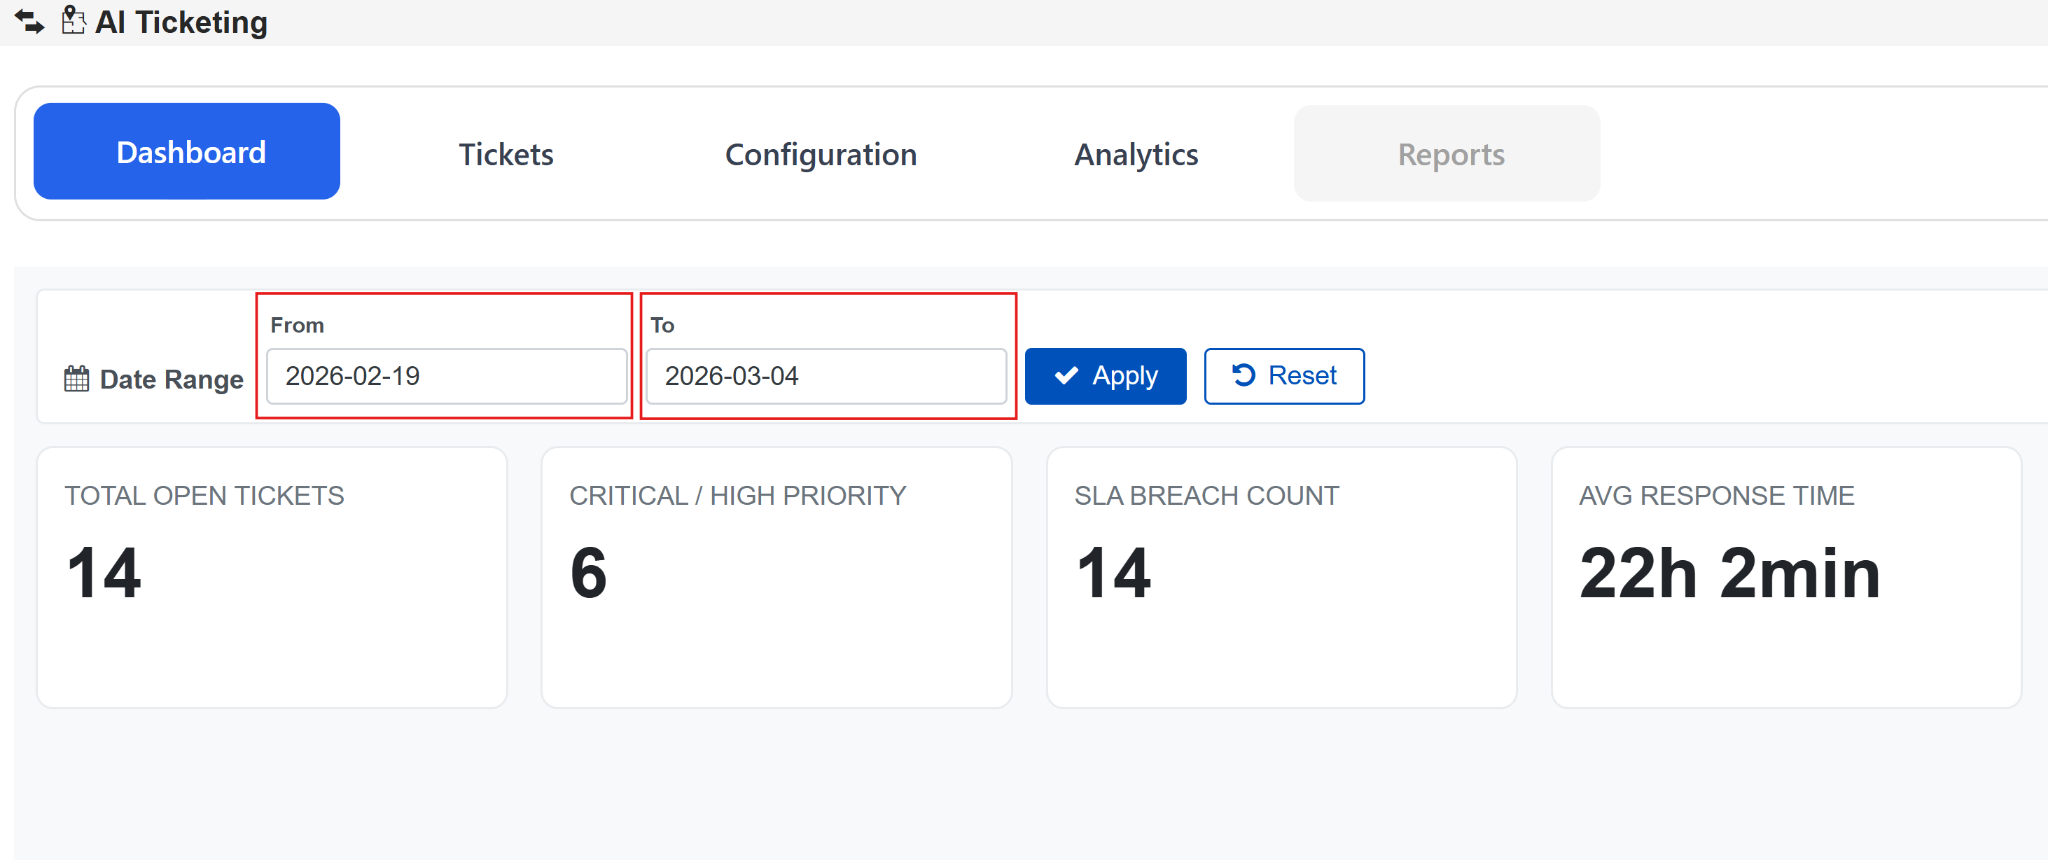
a. Date Range Filter on the Dashboard
- Added a Date Range filter on the Dashboard to allow users to view ticket metrics for a selected time period.
- Users can select From and To dates and apply the filter to update dashboard data.
- All dashboard KPIs (Total Open Tickets, Critical/High Priority, SLA Breach Count, Avg Response Time) update based on the selected date range.
- A Reset option is available to revert to default data view.
- Enhances data analysis by enabling time-based filtering of ticket insights.
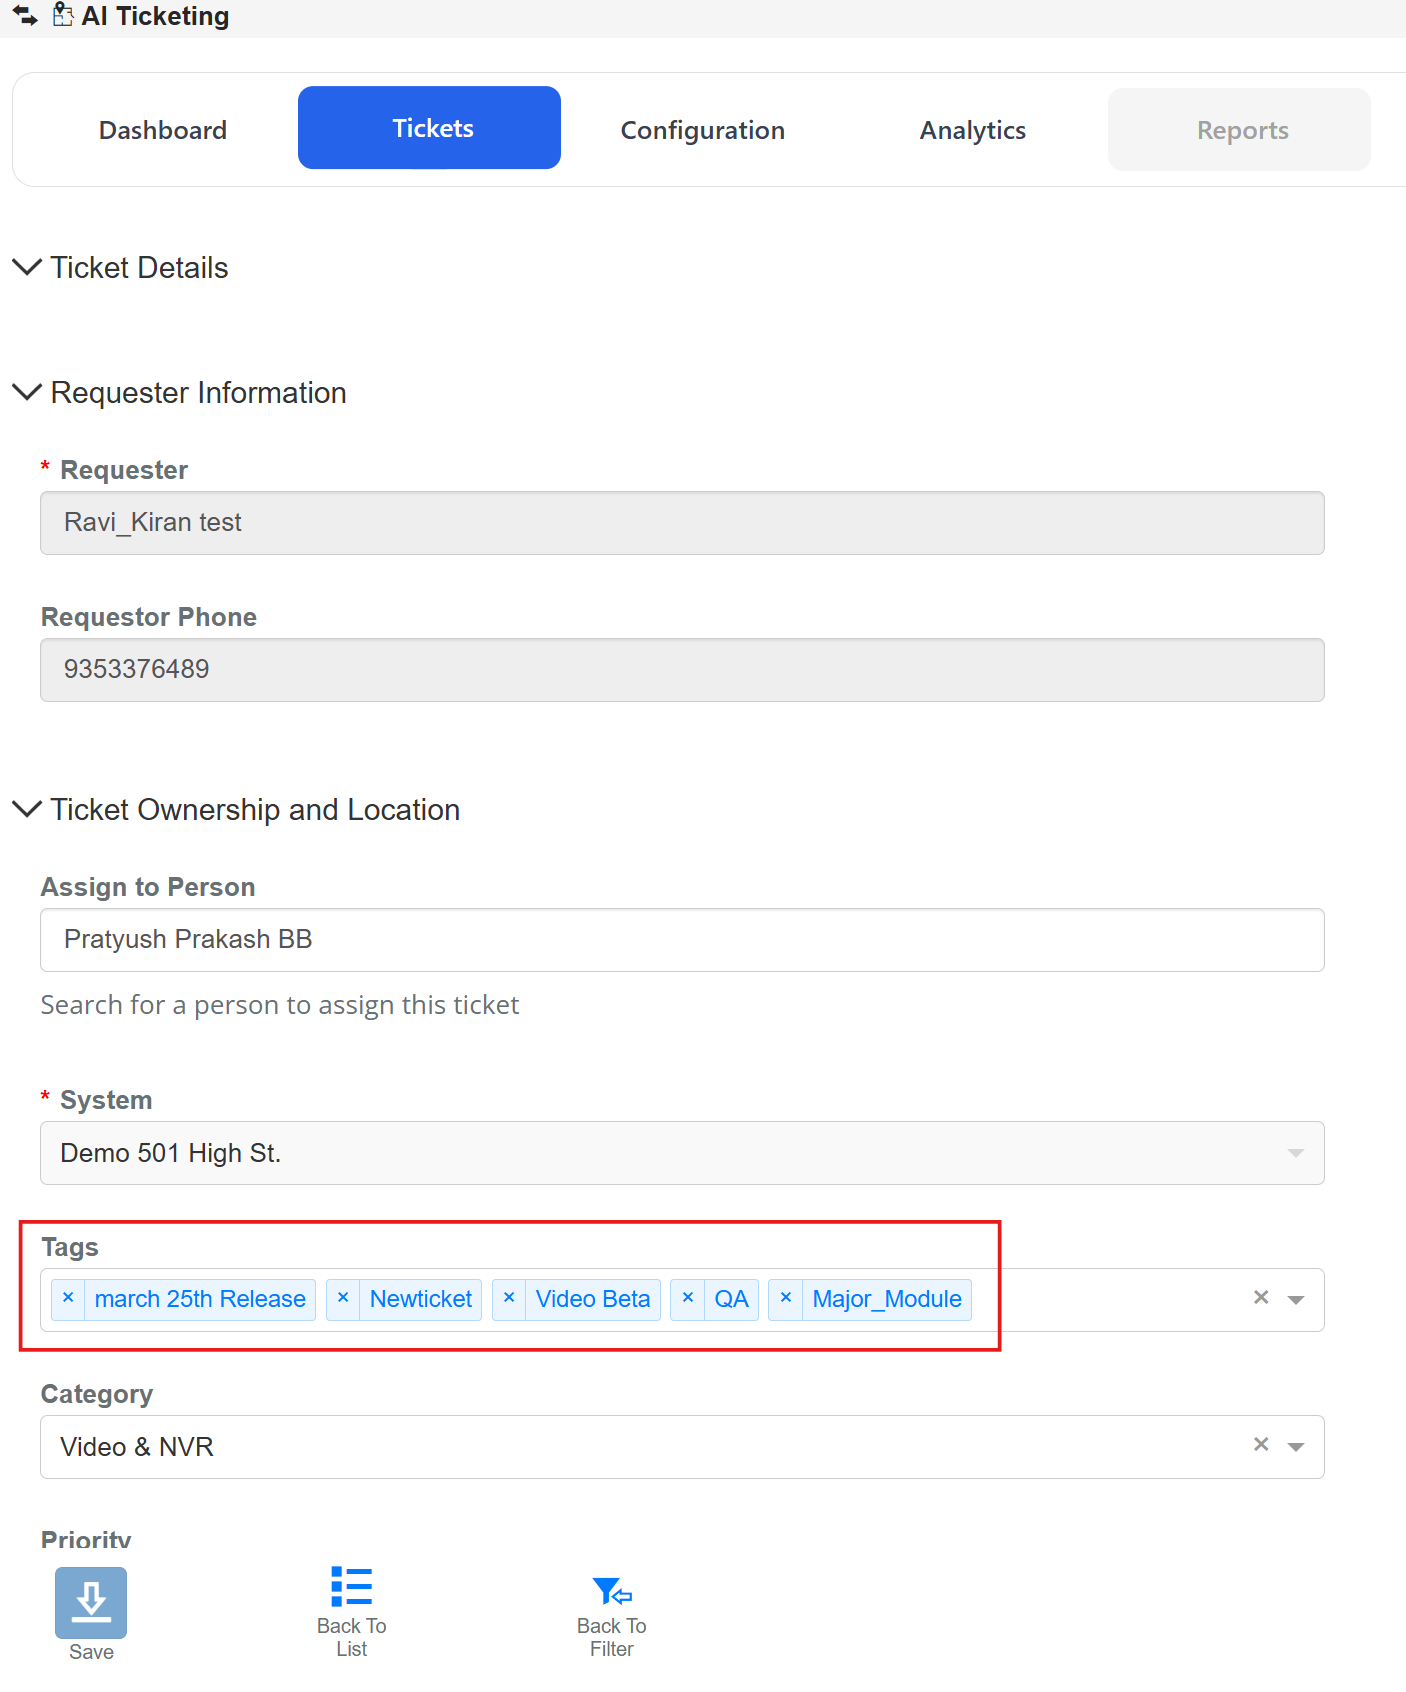
b. Tag Support for Ticket Creation and Update
- Added support to associate one or more tags with tickets during creation and update.
- Users can easily add, view, and remove tags within the ticket form.
- Ticket operations continue to work seamlessly even when no tags are provided.
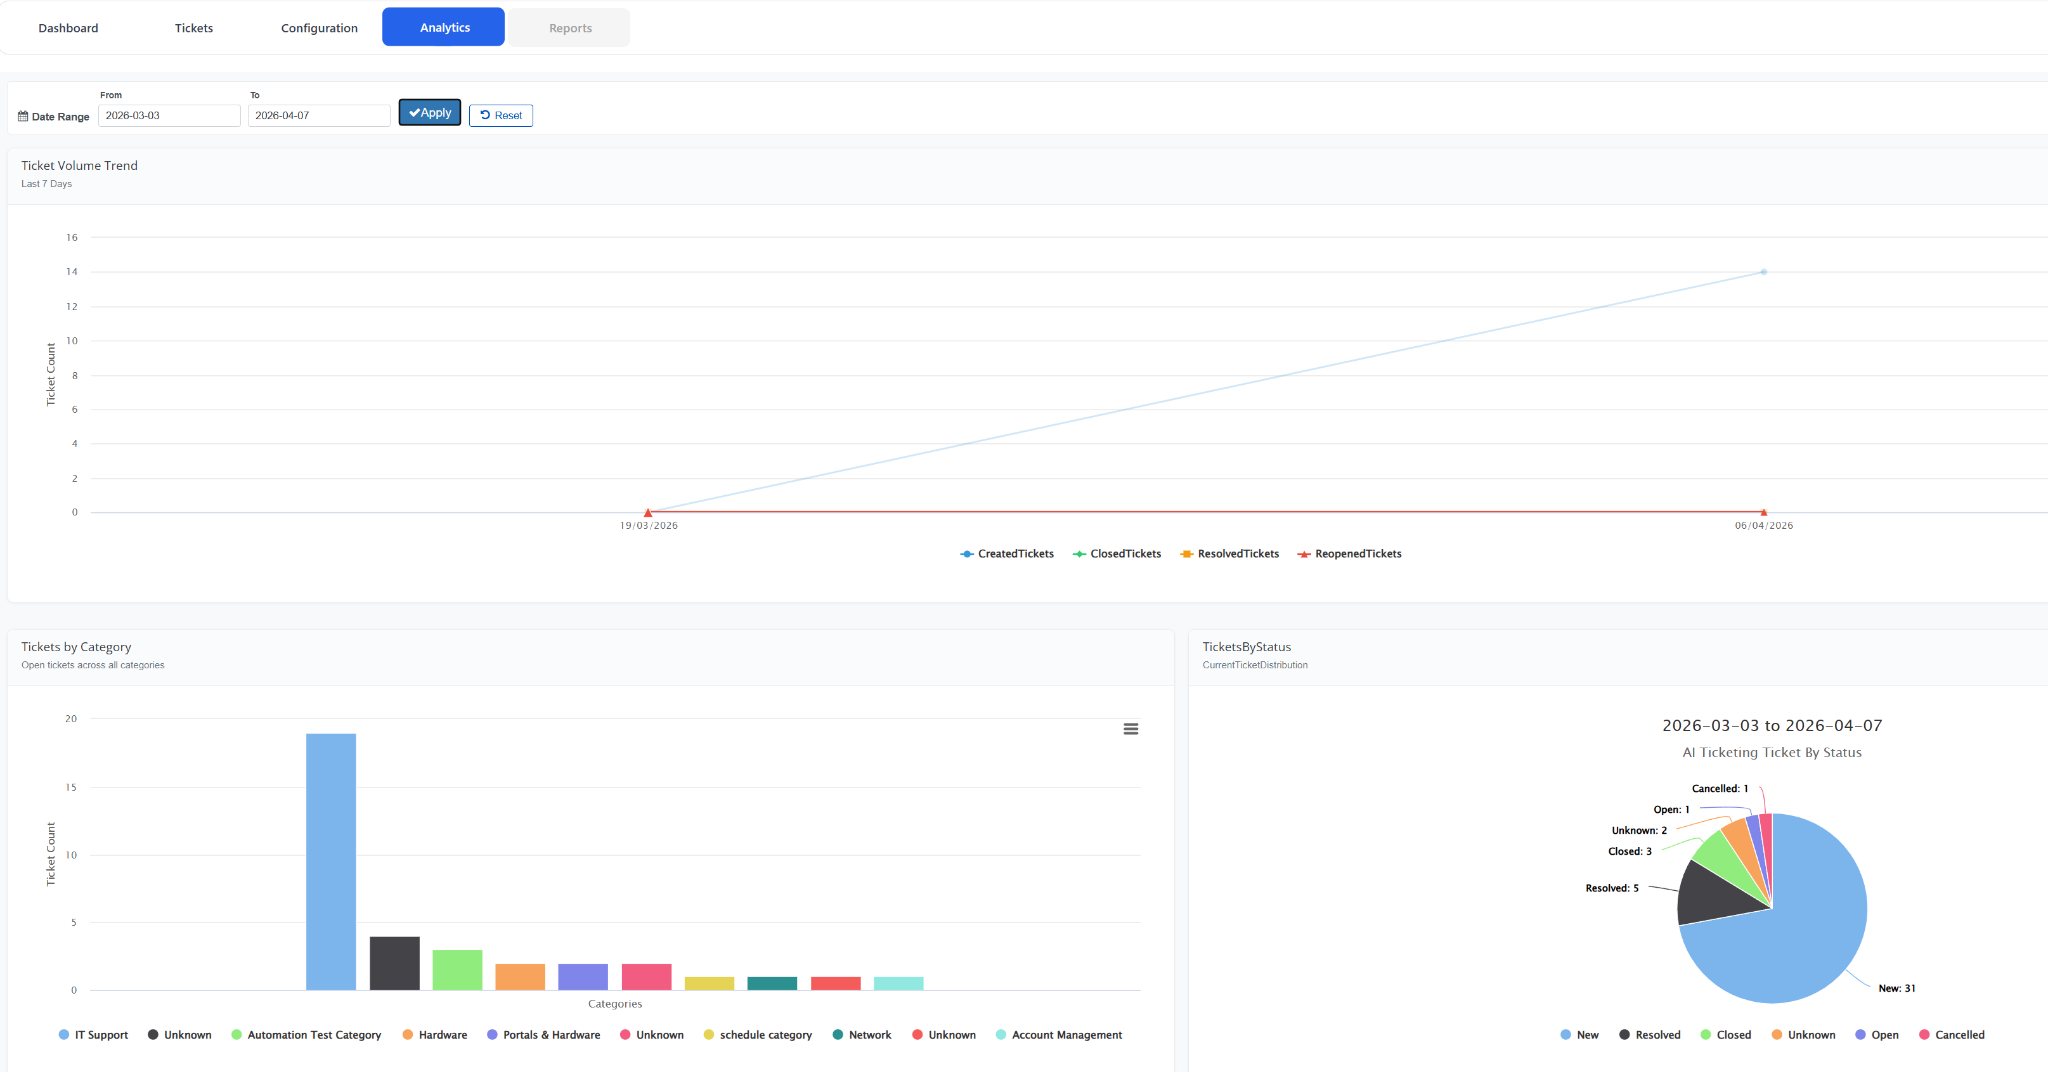
c. Analytics Dashboard for AI Ticketing
- Introduced a new Analytics module providing visual insights into ticket data and trends.
- Includes Ticket Volume Trend graph to track created, closed, resolved, and reopened tickets over time.
- Displays Tickets by Category and Tickets by Status charts for better distribution analysis.
- Supports Date Range filtering to analyze data within a selected time period.
- Enables data-driven decision-making with comprehensive and real-time ticket analytics.
Interactive Maps Enhancements
a. Auto Label Pipeline V2 Integration
i. Integrated the Auto Label Backend Pipeline V2 with Interactive Maps to improve the accuracy and reliability of label generation and placement.
ii. BluSKY Region and Landmark labels are now automatically rendered at the center of their respective ROIs, improving label visibility and spatial accuracy.
iii. Resolved an issue where duplicate detection label names appeared on hover when the pipeline was triggered without any device movement.
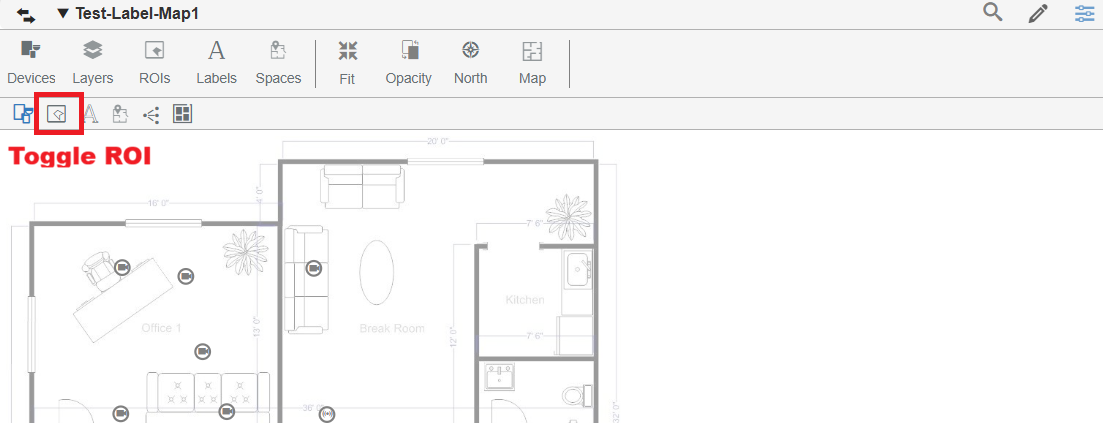
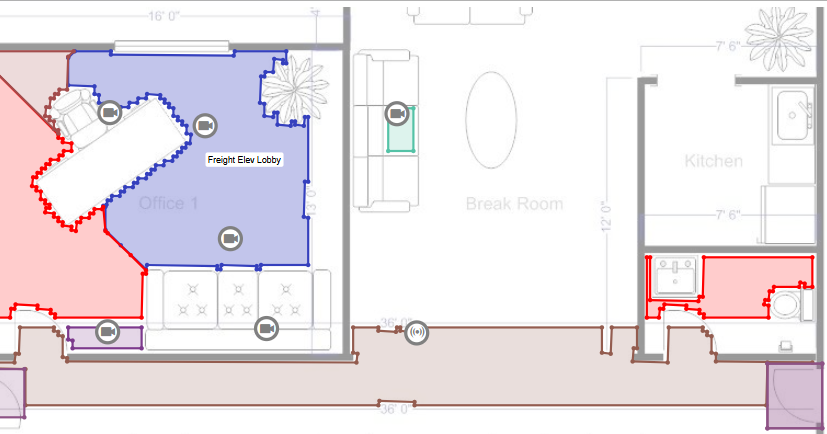
b. ROI Layer Visibility on Interactive Maps
i. Added support to display ROIs as a dedicated layer on the Interactive Maps page through the subtools toggle.
ii. When an ROI layer is enabled, ROIs are rendered directly on the map as colored overlays — providing a clear visual of the spatial regions associated with each device.
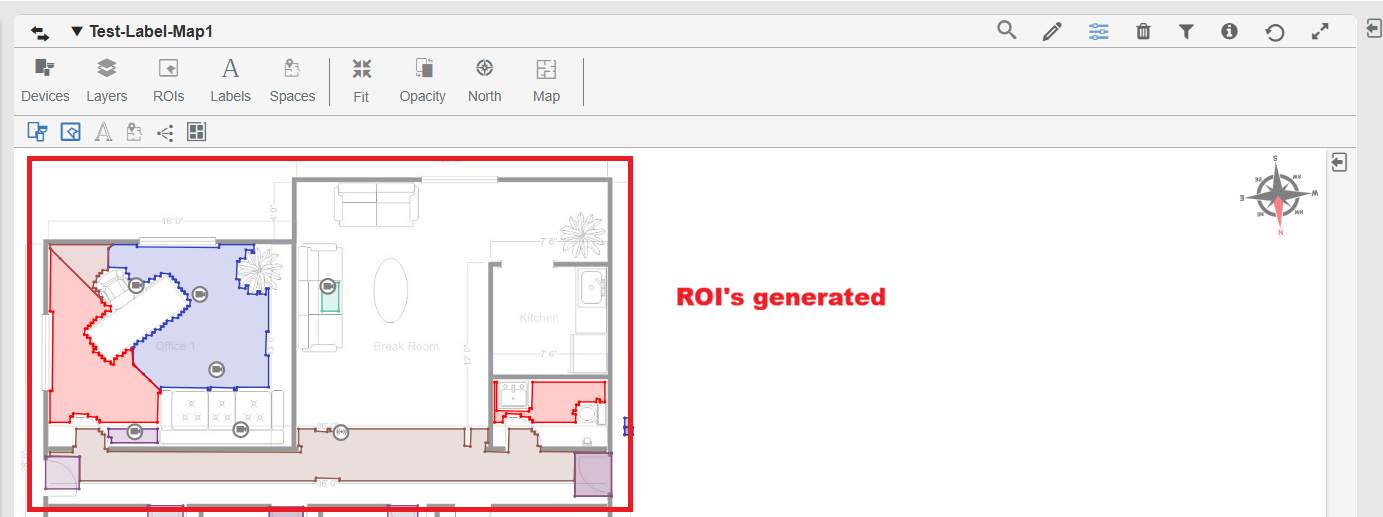
iii. When hovering over an ROI, the ROI label is displayed at the center of the region, providing clearer identification.
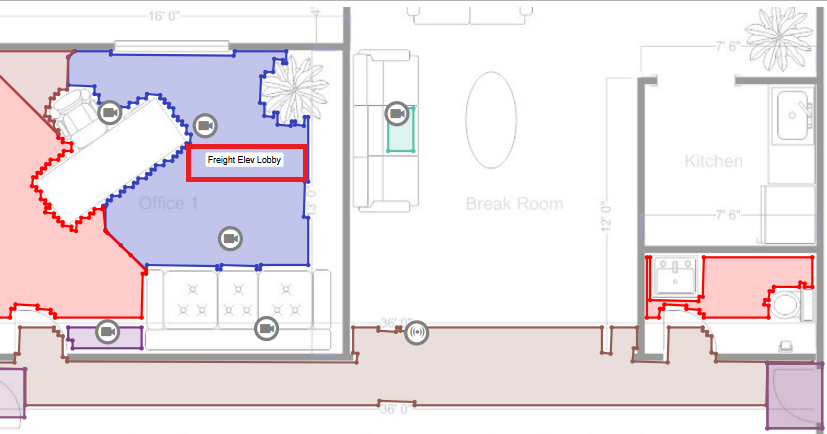
iv. ROI labels are visible in both view mode and edit mode, ensuring consistent map context during monitoring and editing.
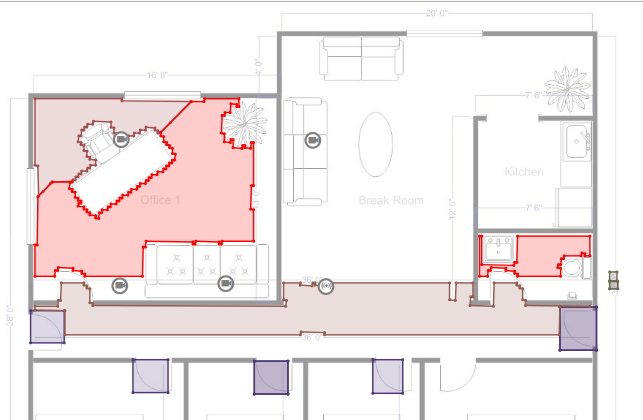
v. ROIs now automatically refresh on the map whenever a new mask file is generated, ensuring that the displayed regions always reflect the latest pipeline-generated data.
Before changing the device location / adding / deleting a device:
After deleting a device and a new mask file is generated:
OracleChat Agentic System
a. View and Query Support Tickets Through Conversation
i. You can now view and query support tickets directly through OracleChat — simply by asking in plain language. There's no need to navigate separate menus or forms. OracleChat automatically fetches relevant details and context to give you accurate, up-to-date information.
ii. What you can do:
- View the status of existing support tickets anytime
- Query specific tickets for detailed updates
- Retrieve relevant building data associated with your tickets
b. Access All 105 Reports Through Natural Conversation
i. Property managers and BluB0X users can now generate any of the 105 available reports simply by asking OracleChat. The system understands report names even if you don't type them exactly — it uses smart matching to find the right report. Access is automatically filtered based on your role and permissions, so you'll only see reports you're authorized to run.
ii. Examples of what you can ask:
- "Show me the occupancy report for Building A"
- "Generate a visitor log for last month"
- "What reports are available to me?"
c. Cancel a Request at Any Time
i. If OracleChat is taking longer than expected to respond, you can now cancel your request mid-flight. The system will cleanly stop processing and free up resources, so you can rephrase your question or try something else right away.
BluB0X AI
a. BluB0X AI — Dashboard Integration
i. A new Floating Action Button now appears in the bottom-right corner of every dashboard page. It stays visible at all times — even as you scroll — giving you one-click access to the BluB0X AI assistant without interrupting what you're doing.
ii. The button displays the BluB0X AI icon and responds to hover and click interactions in line with modern UI/UX standards. It is designed to remain accessible without blocking important dashboard content.
iii. What this means for you:
- The AI assistant is always one click away on every dashboard page
- No need to navigate to a separate section to start a conversation
- The button stays anchored to the bottom-right corner regardless of how far you scroll
b. A Full Chat Interface Opens Right on the Dashboard
i. Clicking the Floating Action Button opens a floating chat window directly over your current dashboard view — no page navigation required. You can interact with the BluB0X AI assistant while continuing to monitor your dashboard in the background.
ii. The chat window includes everything you need for a natural conversation:
- Chat header identifying the BluB0X AI assistant
- Conversation area showing the full back-and-forth between you and the AI
- Text input field for typing your questions or requests
- Microphone icon for voice input — dictate your message hands-free
- Send button to submit your message
- Scrollable history to review earlier messages within your session
- Close / minimize option to hide the window whenever you need more screen space
c. File Attachments in Oracle Chat
i. You can now attach files directly within the Oracle Chat interface when sending a message. When you include a file, it is automatically uploaded to the BluSKY Data Lake before the message is sent — ensuring it is securely stored and immediately available for the AI to process.
ii. Supported file types include documents, PDFs, and other formats accepted by the backend. The system provides clear feedback if an upload succeeds or fails, so you always know the status of your attachment.
iii. The workflow is straightforward:
- Attach one or more files to your chat message
- The file is uploaded to Data Lake in the background
- The file is associated with your message
- If the upload fails, you are notified immediately with an error message
Alarm Analytics: Historical Alarm Statistics for Smarter Anomaly Detection
a. Added a new statistical cube for alarm events that uses historical data to establish baseline activity patterns for alarm analytics.
b. The new cube processes historical alarm event data from the GraphAlarmEventCounts fact table and calculates key statistical metrics, including:
i. Mean ii. Standard Deviation iii. 95th Percentile iv. 99th Percentile
c. These values are stored for efficient downstream use and support z-score calculations, anomaly detection, and risk scoring for alarm activity.
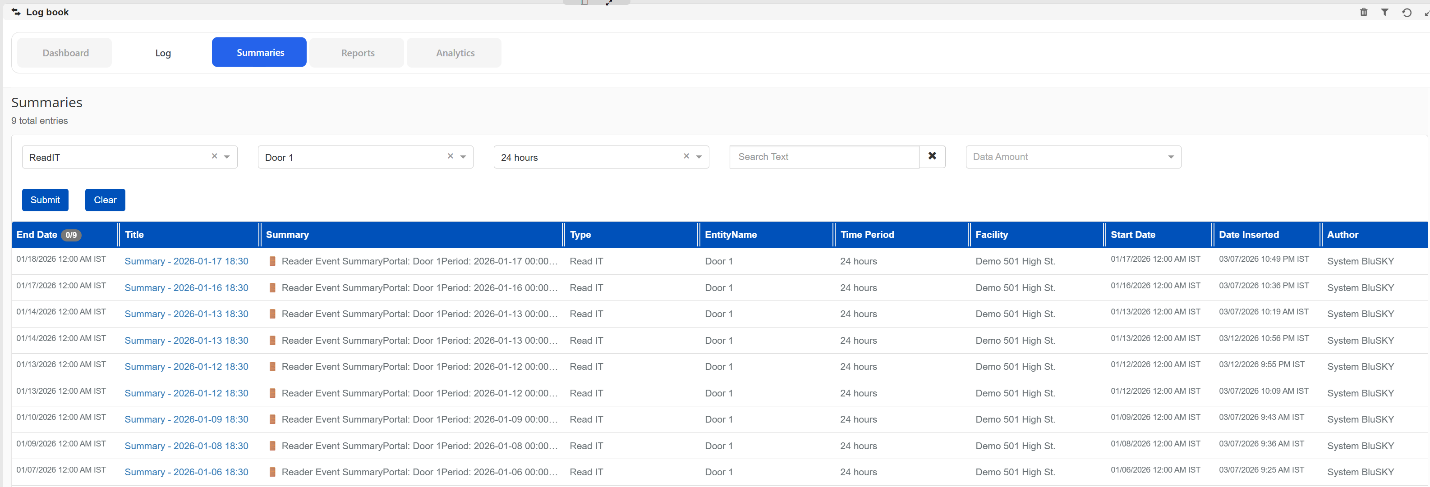
Logbook Summaries
a. ReadIT LogBook Summary Enhancements
i. The ReadIT LogBook Summaries experience has been enhanced to support single reader summary scenarios.
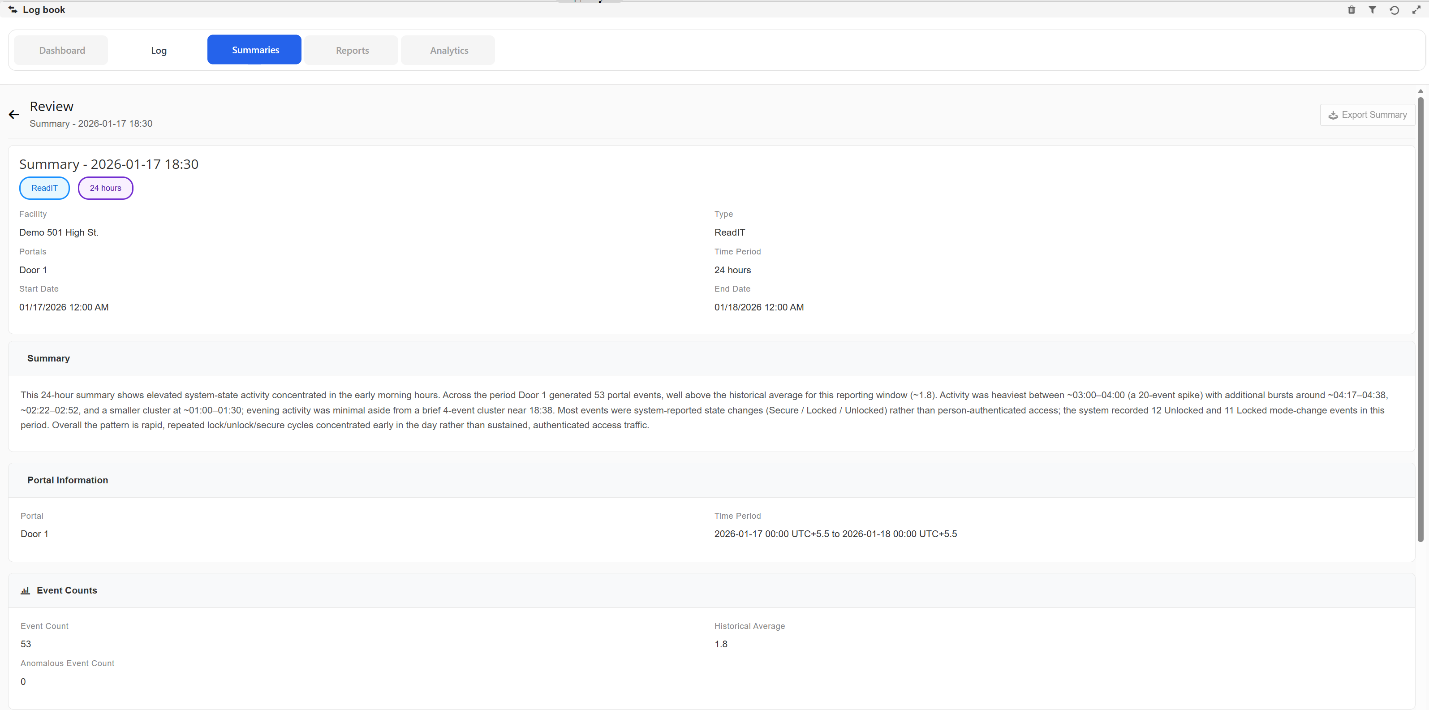
ii. When a user selects a specific portal in LogBook → Summaries, BluSKY now displays a richer Reader Summary view with a consolidated overview of activity and risk posture.
iii. ReadIT Summary includes:
- Summary details
- Portal Information
- Event Counts
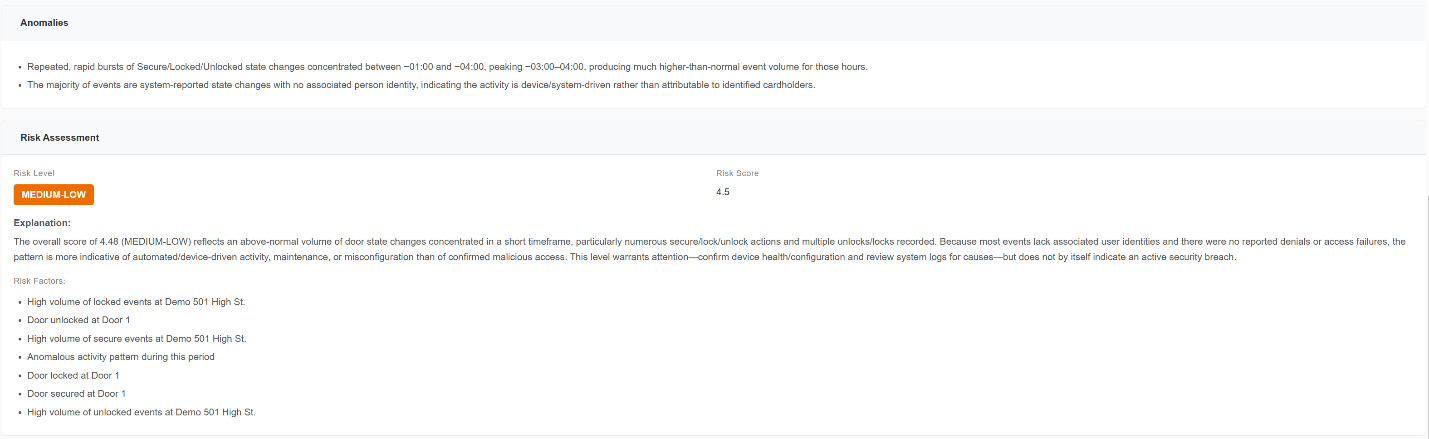
- Anomalies
- Risk Assessment, including:
- Risk Level
- Risk Score
- Explanation