Interactive Maps
BluSKY Console
Screen Overview
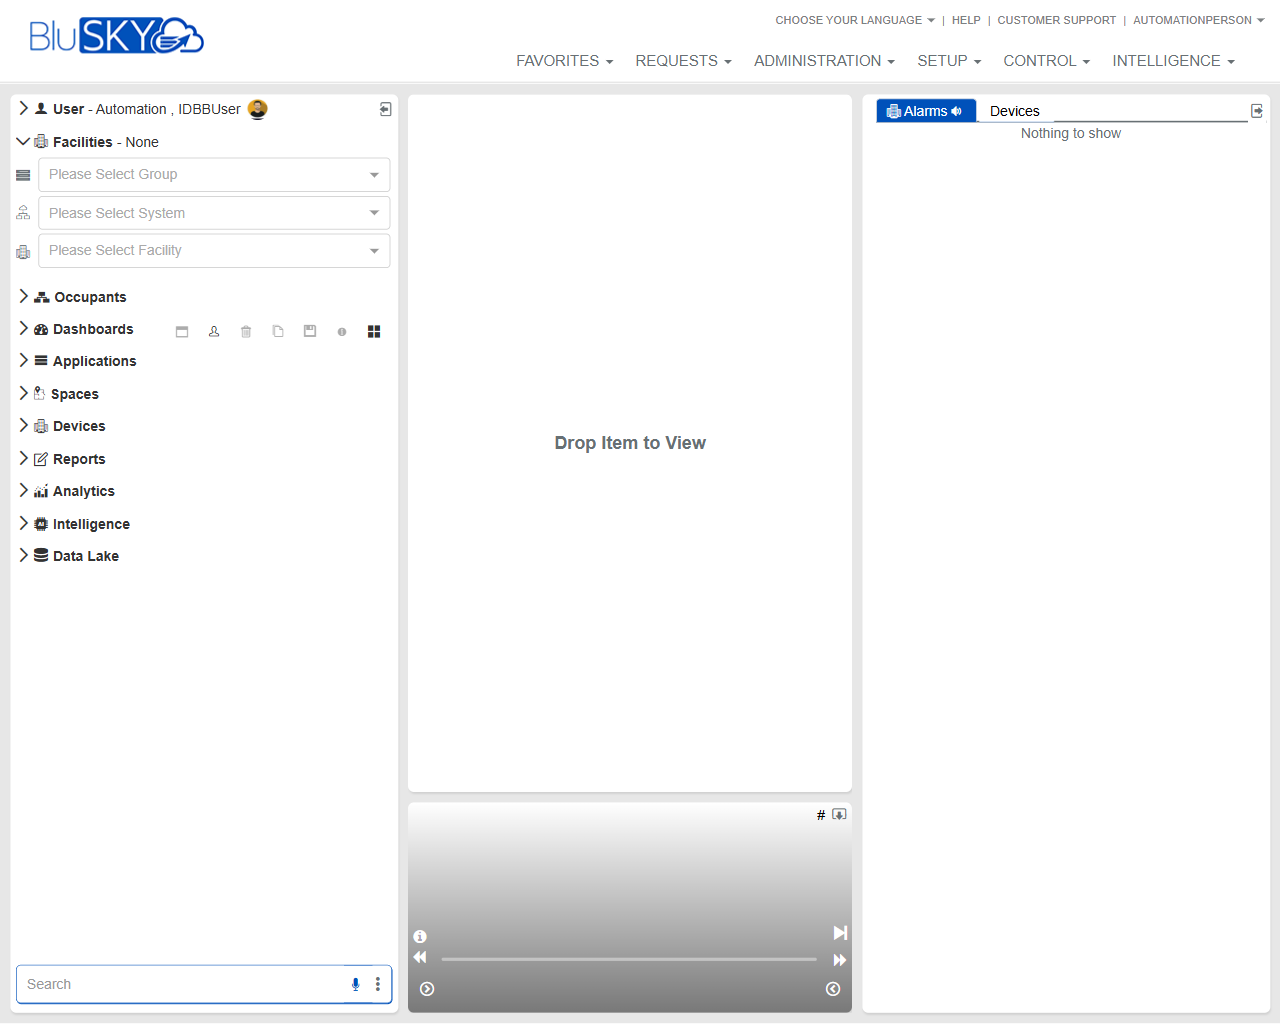
The BluSKY Console is the primary workspace for navigating, monitoring, and managing your BluSKY environment. It provides:
- A left navigation panel to select facilities and browse functional areas (Occupants, Dashboards, Devices, Reports, etc.).
- A central drag‑and‑drop workspace where selected items are opened for viewing and control.
- A right monitoring dock for Alarms and Devices.
- A global top menu for Favorites, Requests, Administration, Setup, Control, and Intelligence.
Use this screen to quickly find objects, open dashboards or devices, and monitor live alarms across selected facilities.
Field Definitions
| Field Label | Definition | Notes |
|---|---|---|
| Signed‑in User | Displays the current user account in the top left of the navigation panel. | Read‑only; may open profile/settings in some deployments. |
| Language Selector | Dropdown in the top banner to choose UI language. | Changes apply immediately to labels and menus. |
| Help | Link in the top banner to product help resources. | Opens documentation in a new tab. |
| Customer Support | Link in the top banner for contacting BluSKY support. | Availability depends on subscription. |
| Favorites (top menu) | Global menu to access saved items and pinned views. | Contents are user‑specific. |
| Requests (top menu) | Menu for service or workflow requests. | May be hidden if not enabled. |
| Administration (top menu) | Menu for administrative functions (users, roles, tenants). | Requires elevated permissions. |
| Setup (top menu) | Menu for configuring systems, facilities, and integrations. | Availability based on role. |
| Control (top menu) | Menu for operational tools (live control, commands). | Real‑time actions; permissions required. |
| Intelligence (top menu) | Menu for analytics and intelligence features. | May require separate licensing. |
| Facilities Header | Displays current facility context (e.g., “Facilities – None”). | Shows scope for data and monitoring. |
| Group Filter | Dropdown to select a Group of facilities/systems. | Drives the System and Facility filters. |
| System Filter | Dropdown to select a System within the chosen Group. | Options refresh after Group selection. |
| Facility Filter | Dropdown to select a specific Facility. | Determines what appears in navigation and monitors. |
| Occupants (navigation) | Section for people/identity management. | Expand to access person records and related tools. |
| Dashboards (navigation) | Section to access predefined or custom dashboards. | Icons next to label may open quick actions. |
| Applications (navigation) | Section for app‑level functions available to the tenant. | Contents vary by deployment. |
| Spaces (navigation) | Section for locations, floors, and areas. | Useful for spatial navigation. |
| Devices (navigation) | Section for hardware endpoints (panels, readers, sensors, etc.). | Drag items to the workspace to view. |
| Reports (navigation) | Section to run and export reports. | Some reports honor current facility filters. |
| Analytics (navigation) | Section for analytical views and visualizations. | Requires licensing/permissions. |
| Intelligence (navigation) | Advanced intelligence features in the left tree. | May mirror the top menu entry. |
| Data Lake (navigation) | Access to data lake objects and exports. | Enterprise feature; may be hidden. |
| Navigation Search | Search box at the bottom left to find items in the tree. | Supports partial matches; press Enter to execute. |
| Central Workspace Canvas | Main pane labeled “Drop Item to View” for opening items. | Accepts drag‑and‑drop from the navigation tree. |
| Viewer Controls Bar | Control strip below the workspace (info, mute, play/navigation). | Appears for media/event playback enabled views. |
| Alarms Dock (right) | Right panel showing live alarms. | Includes audio indicator and count; may be collapsible. |
| Devices Dock (right) | Right panel listing currently opened/monitored devices. | Shows “Nothing to show” when empty. |
Screen Actions and Functions
- Select Group/System/Facility to set the working context for navigation and monitoring.
- Expand navigation sections and drag items (e.g., a dashboard or device) into the central workspace.
- Double‑click items in the navigation to open them in the workspace (where supported).
- Monitor live activity in the Alarms dock; click an alarm to open details in the workspace.
- Use the Devices dock to switch between opened devices or clear the list.
- Use Navigation Search to quickly locate people, devices, reports, or dashboards.
- Adjust audio/notifications via the Viewer Controls Bar or the Alarms dock speaker icon.
- Access global functions from the top menus (Favorites, Requests, Administration, Setup, Control, Intelligence).
- Collapse/expand the left navigation or right docks to maximize workspace area.
Usage Instructions & Examples
How to set your working facility
- Open the Group Filter and choose the relevant group.
- Open the System Filter and select the system within that group.
- Open the Facility Filter and select the target facility.
- Confirm the Facilities header reflects your selection.
How to open a dashboard in the workspace
- Expand Dashboards in the left navigation.
- Drag a dashboard entry onto the central workspace labeled “Drop Item to View.”
- The dashboard renders; use any on‑screen controls to interact or filter.
How to view and monitor a device
- Expand Devices in the left navigation and locate the device.
- Drag the device into the central workspace.
- Observe live status; the device also appears in the Devices dock for quick return.
How to review an alarm
- Watch the Alarms dock for new entries or a count/badge.
- Click an alarm in the dock to open details in the workspace.
- Take the appropriate action (acknowledge, investigate, or escalate) per your policy.
How to find items using search
- Enter a keyword in the Navigation Search box (e.g., person name, device alias).
- Press Enter to filter the left navigation.
- Drag the desired result into the workspace or double‑click to open.
System Behaviors and Edge Cases
- Filters are hierarchical: changing Group resets and repopulates System and Facility options.
- When no facility is selected, many navigation items may show limited or no results.
- If there are no active alarms, the Alarms dock displays “Nothing to show.”
- Items unsupported for drag‑and‑drop will not open in the workspace; use double‑click instead.
- Unsaved workspace content is cleared on page refresh or session timeout.
- Alarm audio follows user preferences; muting silences new alarm sounds but does not stop alarm creation.
- Permissions determine which navigation sections and top menus are visible.
- Large trees may truncate until search or filter is applied for performance.
- Mobile or small screens may auto‑collapse the right dock to preserve space.
Permissions
- Global Administrators: Full access to all menus, filters, and docks.
- Tenant/Facility Administrators: Can configure within their scope; full workspace use.
- Operators/Dispatchers: Can monitor alarms and devices; limited Administration/Setup.
- Read‑only Users: Can view dashboards and reports; cannot control devices or acknowledge alarms.
- Access to Analytics, Intelligence, Data Lake, and certain reports is license- and role‑dependent.
Linked Workflows
- Alarm Handling: Acknowledge, investigate, and resolve alarms from the workspace.
- Device Management: Open device panels to view status, send commands, or review history.
- Dashboard Management: Create or modify dashboards available under the Dashboards navigation.
- Reporting: Generate and export operational or audit reports from the Reports section.
- Facility and System Setup: Configure Groups, Systems, and Facilities under the Setup and Administration menus.
Reference Image Links