Portals
Dashboards Screen
Screen Overview
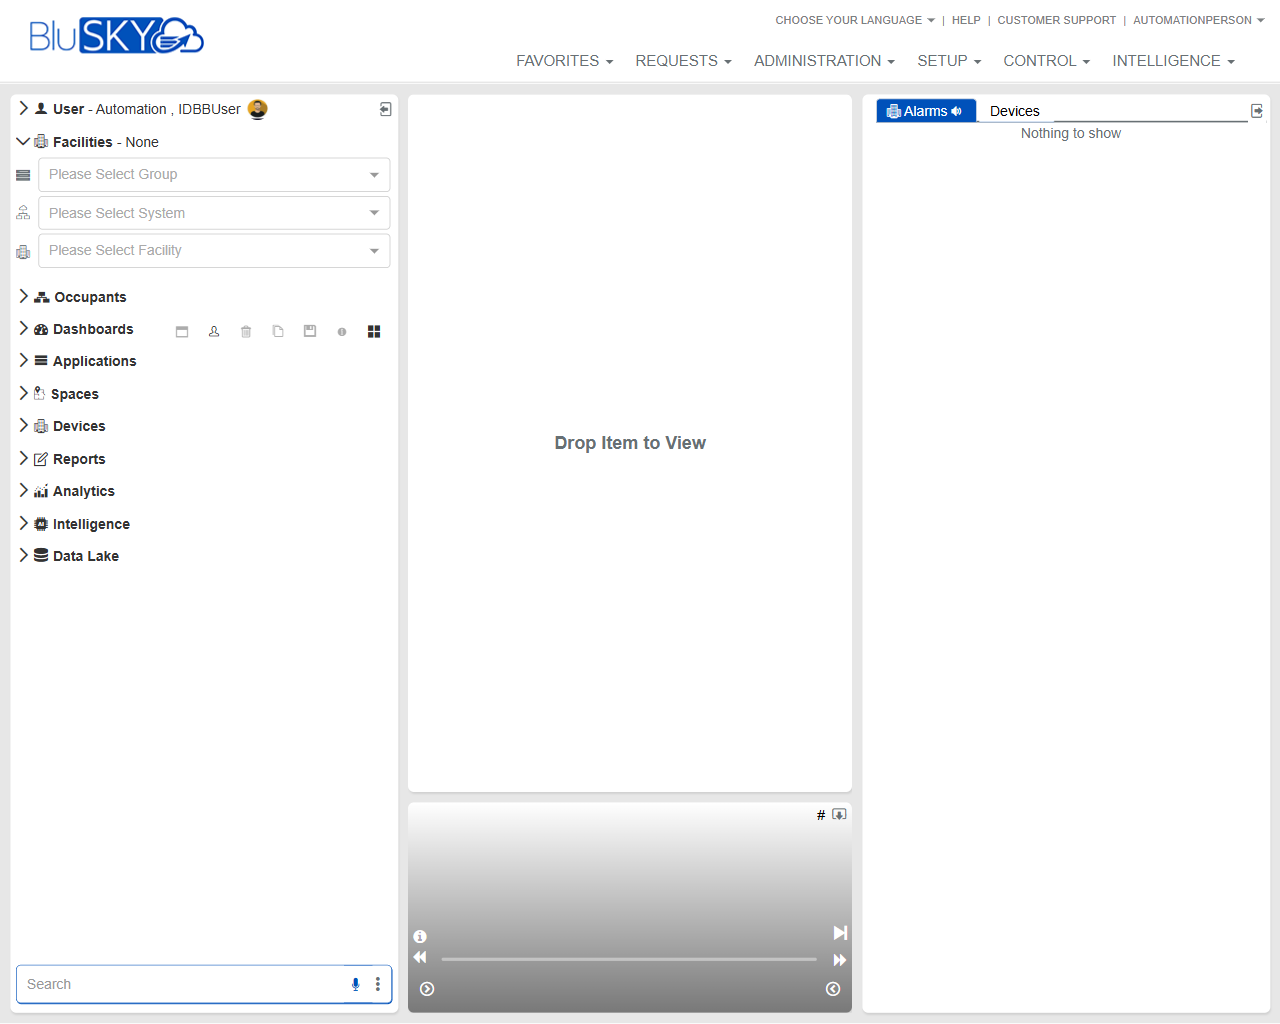
The Dashboards screen provides a flexible workspace to view live information from BluSKY modules. Users can set context using Group/System/Facility selectors, then drag items from the navigation tree into the central canvas to display dashboards, device views, reports, or analytics. A right-side Alarms panel shows real-time events for the selected scope.
Field Definitions
| Field Label | Definition | Notes |
|---|---|---|
| User Badge | Displays the signed-in user name and role. | Read-only; indicates current security context. |
| Facilities – None | Current facility scope indicator. | Updates after selecting Group/System/Facility. |
| Please Select Group | Dropdown to choose the organizational Group. | Required to populate System and Facility lists. |
| Please Select System | Dropdown to choose the security System within the selected Group. | Options filter based on Group. |
| Please Select Facility | Dropdown to choose a Facility within the selected System. | Sets the working scope for dashboards and alarms. |
| Navigation Tree (Occupants, Dashboards, Applications, Spaces, Devices, Reports, Analytics, Intelligence, Data Lake) | Expandable list of modules and items available to view. | Drag items from here to the canvas to open them. |
| Search (bottom-left) | Quick search box for finding items in the navigation tree. | Supports text search; gear icon opens search options (if enabled). |
| Canvas (Drop Item to View) | Main workspace where selected items are displayed. | Accepts drag-and-drop from the navigation tree. |
| Alarms Panel | Right-side panel that shows live alarms and events. | Real-time; displays “Nothing to show” when no data or scope selected. |
| Alarms Scope Selector (Devices) | Dropdown within the Alarms panel to choose what source to display (e.g., Devices). | Options depend on user permissions and system configuration. |
| Playback/Timeline Controls (bottom of canvas) | Controls for playing/pausing event or video timelines when supported by the displayed item. | Read-only unless the loaded widget supports playback. |
| Global Menu Bar (Favorites, Requests, Administration, Setup, Control, Intelligence) | Top navigation to other BluSKY areas. | Context changes may open in the same tab or a new tab per system settings. |
Screen Actions and Functions
- Select Group/System/Facility to define the working scope.
- Expand the navigation tree and drag items to the canvas to open dashboards or views.
- Use the Search field to locate items quickly within the navigation tree.
- Monitor real-time events in the Alarms panel; adjust its scope via the dropdown.
- Expand/collapse left navigation sections to manage workspace space.
- Refresh the canvas or right panel when needed (browser refresh or panel controls, when available).
- Clear scope selectors to reset the workspace back to a neutral state.
Usage Instructions & Examples
-
View a facility dashboard
- Click Please Select Group and choose the appropriate Group.
- Click Please Select System and choose the System.
- Click Please Select Facility and choose the Facility.
- In the navigation tree, expand Dashboards and drag the desired dashboard onto the canvas.
-
Monitor device alarms in real time
- Set Group/System/Facility as needed.
- In the right Alarms panel, choose Devices from the scope selector.
- Observe incoming events; if supported, click an event to open related detail in the canvas.
-
Find and open an item by search
- In the bottom-left Search field, type part of the item name.
- Select the matching item from results in the navigation tree.
- Drag the item to the canvas to open it.
System Behaviors and Edge Cases
- The System and Facility selectors are dependent: options filter based on the prior selection.
- If no Facility is selected, the canvas shows “Drop Item to View” and the Alarms panel may show “Nothing to show.”
- Drag-and-drop is blocked for items the user is not permitted to view.
- Real-time alarms require network connectivity; temporary outages may result in an empty Alarms panel until reconnected.
- Some items placed on the canvas may not support playback controls; the timeline area remains disabled in that case.
- Session-level scope selections typically persist during the current login; a full logout clears them.
- Large data views may take longer to render; do not navigate away until loading completes.
Permissions
- Access to the Dashboards screen requires a role with view/monitor rights (e.g., Operators, Tenant Administrators, Global Administrators).
- Visibility of items in the navigation tree is governed by module-specific read permissions.
- Viewing live alarms requires alarm/monitor privileges for the selected Group/System/Facility.
- Some dashboards or widgets may require additional feature entitlements (e.g., Analytics or Intelligence).
Linked Workflows
- From an alarm event, open the related device or location record for investigation.
- From the Devices module, drag device views into the canvas, then generate Reports if deeper analysis is needed.
- Use Administration or Setup menus to manage Groups/Systems/Facilities that drive the screen’s scope.
- After analyzing events, pivot to Analytics or Intelligence modules for trend analysis.
Reference Image Links