Dashboard
Workspace Screen
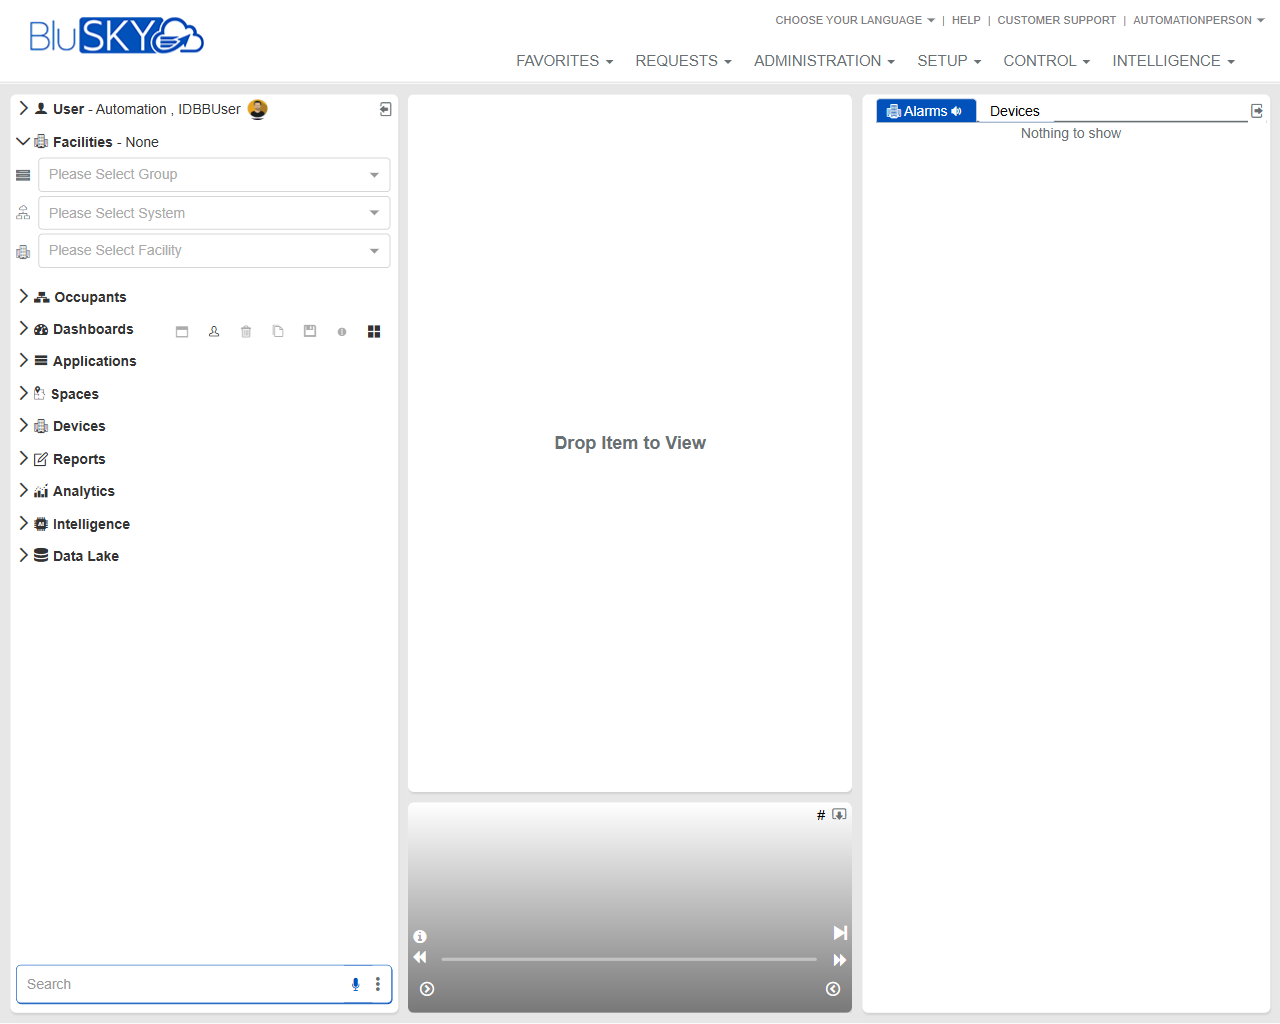
Screen Overview
The Workspace screen is the primary landing and monitoring area in BluSKY. It provides a drag‑and‑drop canvas for viewing items (e.g., devices, dashboards), a right‑side Alarms panel, and left navigation with facility context selectors and a searchable menu. Use this screen to quickly locate entities, monitor live activity, and open items for detailed viewing.
Field Definitions
| Field Label | Definition | Notes |
|---|---|---|
| User – [current user] | Displays the signed‑in user and quick user menu. | Location: upper left sidebar header. Read‑only. |
| Facilities – None | Current facility context indicator. | Shows “None” until a facility is selected. |
| Please Select Group | Dropdown to choose a Group (portfolio/organization scope). | Drives available Systems and Facilities. Required for scoped navigation. |
| Please Select System | Dropdown to choose a System within the selected Group. | Filters Facilities and items to the chosen system. |
| Please Select Facility | Dropdown to choose a Facility. | Sets the working context for navigation and alarms. |
| Occupants | Navigation node to people/tenant-related pages. | Expand/collapse to reveal sub-items. |
| Dashboards | Navigation node for prebuilt dashboards. | Items may be drag‑and‑drop compatible with the workspace. |
| Applications | Navigation node for integrated applications. | Availability depends on subscription and permissions. |
| Spaces | Navigation node for buildings, floors, areas, and maps. | Often supports drag‑and‑drop of maps/space views. |
| Devices | Navigation node for hardware endpoints (e.g., doors, cameras, readers). | Drag compatible devices to the canvas to view. |
| Reports | Navigation node for reporting tools. | Opens report pages; not typically drag‑and‑drop. |
| Analytics | Navigation node for analytic views and widgets. | Availability varies by license. |
| Intelligence | Navigation node for intelligence/insights modules. | Read‑only for most operator roles. |
| Data Lake | Navigation node for data export and exploration. | Advanced/administrator access typically required. |
| Search | Search box for quickly locating navigation items. | Located at bottom-left of the sidebar. |
| FAVORITES (top menu) | Global menu to access saved favorites/layouts. | Opens a dropdown or page depending on configuration. |
| REQUESTS (top menu) | Global menu for service or access requests. | Items vary by tenant configuration. |
| ADMINISTRATION (top menu) | Global menu for administrative functions. | Requires elevated permissions. |
| SETUP (top menu) | Global menu for system setup/configuration. | Access restricted to setup roles. |
| CONTROL (top menu) | Global menu for live monitoring/operations. | Common entry for operators. |
| INTELLIGENCE (top menu) | Global menu for insights/analytics. | Requires appropriate license/permissions. |
| Choose Your Language | Selector to change UI language. | Top-right utility link. |
| Help | Link to online help resources. | Opens in a new tab/window. |
| Customer Support | Link to support contact/resources. | Availability may depend on tenant. |
| Drop Item to View | Central drag‑and‑drop canvas to display selected items. | Accepts compatible items from the left navigation. |
| Player/Timeline Controls | Media/control bar beneath the canvas (play, volume, etc.). | Appears when viewing playable media (e.g., video). |
| Alarms | Right‑hand panel header for live alarms. | Streams alarms in real time for the selected context. |
| Devices (tab within Alarms) | Tab showing device-related alarms. | Displays “Nothing to show” when no active alarms. |
Screen Actions and Functions
- Select Group/System/Facility to set the working context.
- Expand/collapse navigation nodes (Occupants, Devices, etc.).
- Drag compatible items (e.g., devices, maps, dashboards) from the left navigation onto the Drop Item to View canvas.
- Use Player/Timeline Controls to play, pause, mute/unmute, or scrub media when applicable.
- Monitor the Alarms panel; click an alarm (when present) to open its details/view on the canvas.
- Use Search to locate items in the left navigation quickly.
- Change language via Choose Your Language.
- Access Help and Customer Support from the top-right links.
Usage Instructions & Examples
How to set your working context
- Open the Group dropdown and select the desired group.
- Choose the appropriate System.
- Select the Facility. The navigation and alarms will update to this context.
How to view a device on the canvas
- In the left navigation, expand Devices.
- Drag the desired device onto the Drop Item to View area.
- If the item supports media, use the Player/Timeline Controls to play/pause or adjust audio.
How to monitor alarms
- Ensure the correct Facility context is selected.
- Watch the Alarms panel on the right; when alarms appear, select the Devices tab if needed.
- Click an alarm to open its related item on the canvas for assessment.
How to find items quickly
- Type a keyword in the Search field at the bottom-left.
- Select a matching item from the results.
- Either click to navigate or drag it to the canvas if it is draggable.
System Behaviors and Edge Cases
- If no Group/System/Facility is selected, some navigation nodes may be empty, and the Alarms panel may show “Nothing to show.”
- The canvas accepts only compatible items; non-compatible items will not drop onto the view.
- Player/Timeline Controls appear only for items that support playback or audio.
- Alarm listings auto-refresh; when there are no active alarms, the Devices tab displays “Nothing to show.”
- Item availability in the navigation tree is filtered by the selected context and user permissions.
- Rapidly switching facility context clears the canvas and repopulates alarms to prevent stale views.
Permissions
- Access to the Workspace is typically granted to Operator, Tenant Administrator, and Global Administrator roles.
- Viewing specific nodes (Devices, Analytics, Intelligence, Data Lake) requires corresponding module permissions.
- Alarm visibility is limited to facilities and systems the user is authorized to monitor.
- Media playback on the canvas requires view rights to the underlying device/stream.
Linked Workflows
- From a device shown on the canvas, navigate to Setup > Devices to configure properties (admins only).
- Use Reports to analyze historical activity related to items viewed on the canvas.
- From an alarm opened on the canvas, continue to alarm history or incident workflows as enabled by your tenant.
- Save commonly used pages or layouts under Favorites for quick access.
Reference Image Links