Monitoring Points
Monitoring Points Screen
Screen Overview
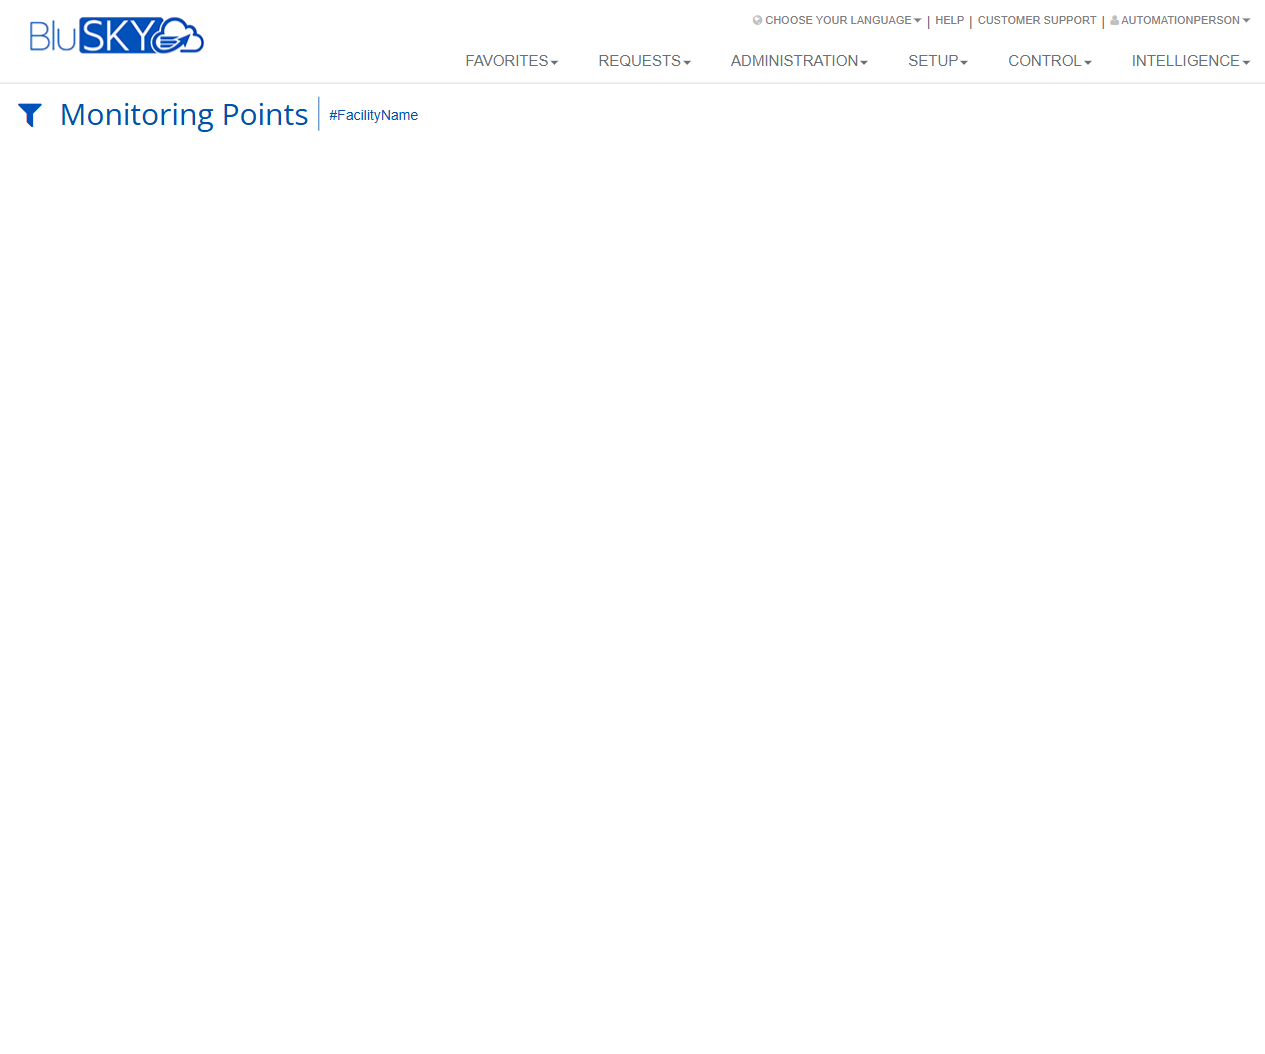
The Monitoring Points screen provides a centralized view of monitoring/IO points configured for a facility. Use it to filter by facility and review the list of points (e.g., inputs, sensors) and their current status. The page in the provided image shows the facility filter and an empty results area that populates once a facility is selected.
Field Definitions
| Field Label | Definition | Notes |
|---|---|---|
| Facility Name | The facility context for which monitoring points are displayed. | Selected via the facility filter. The header shows “#FacilityName” when applied. |
| Filter (funnel icon) | Opens the filter panel to choose or change the facility. | Required to populate the grid. |
| Results Grid | Displays the list of monitoring points for the selected facility. | Appears after a facility is chosen; columns can vary by integration. Common columns below may be shown when available. |
| Point Name | The descriptive name of the monitoring point. | Typically unique within a controller or facility. |
| Status | Current state of the point (e.g., Normal, Alarm, Trouble). | Read-only; updated by the field hardware/integration. |
| Last Event | The most recent event received for the point. | Usually includes event type and timestamp. |
| Controller/Panel | The hardware controller or panel hosting the point. | Helpful for troubleshooting and service dispatch. |
| Board/Device | Sub-device or board on which the point resides. | May be hidden if not applicable to the integration. |
| Address/Channel | The hardware address, channel, or input number. | Read-only; defined during setup. |
| Location | Free-text or hierarchical location description. | Useful for on-site responders. |
| Armed/Bypassed | Indicates if the point is armed, bypassed, or shunted. | Visibility depends on integration and user permissions. |
| Notes | Administrator-entered notes about the point. | Optional; may be hidden if empty. |
| Last Updated | Timestamp of the last status refresh shown in the grid. | Read-only; system-generated. |
Screen Actions and Functions
- Filter – Click the funnel icon to select a Facility Name and apply the filter.
- Clear Facility – Remove the current facility filter to return to an empty grid.
- View Point Details – Click a row (when available) to open the point detail view.
- Refresh – Reload the page to pull the latest data from the service.
- Export – If enabled, export the current grid to CSV/Excel.
- Column Show/Hide – If enabled, choose which columns appear in the grid.
- Sort/Filter in Columns – If enabled, sort by a column or apply per-column filters.
Usage Instructions & Examples
-
Select a Facility
- Click the Filter (funnel) icon.
- Choose the Facility Name.
- Apply the filter. The results grid populates with that facility’s monitoring points.
-
Locate a Specific Point
- With the grid populated, use the column search/filter (if available) or sort by Point Name.
- Optionally use the browser’s find function to highlight matches on the page.
-
Review Point Status
- Identify the point in the grid and check the Status and Last Event columns.
- Click the row to open details (if enabled) for more event history and metadata.
-
Export the List (optional)
- Click Export (if available).
- Choose CSV/Excel and download the file for offline analysis.
System Behaviors and Edge Cases
- If no facility is selected, the grid remains empty. This is expected behavior.
- Facility selection typically persists for the current session; switching facilities repopulates the grid.
- Column availability can vary by hardware integration and tenant configuration; some fields may be hidden.
- Large facilities may paginate results or load on demand; exporting may be limited to the current page if server-side pagination is used.
- Real-time updates depend on integration; if auto-refresh is not enabled, use Refresh to see the latest status.
- Users only see facilities and points they are permitted to view; restricted items are not listed.
- If the integration service is temporarily unavailable, the grid may appear blank or show a warning until connectivity is restored.
Permissions
- Visible to Global Administrators, Tenant Administrators, and Operators with view rights to Monitoring Points.
- Export, column configuration, and detail views may require additional permissions (e.g., ExportData, ViewPointDetails).
- Facility visibility is constrained by the user’s assigned facilities and roles.
Linked Workflows
- From a point’s detail view, access:
- Event/Alarm History for the selected point.
- Hardware Controller/Panel details for troubleshooting.
- Configuration pages (if the user has setup permissions) to edit point metadata.
- Operators may pivot to Alarm/Monitoring consoles to acknowledge or investigate active events.
Reference Image Links